Prerequisites
- A running Kubernetes cluster.
kubectlconfigured.Helm 3installed on your local machine.
Step 1: Add the Prometheus Helm repository
Step 2: Install the Prometheus stack
Install everything (Prometheus, Grafana, Alertmanager) with one command:Step 3: Verify installation
Check pods status
Check if all pods are running:You should see the pods of the monitoring stack running:
Step 4: Access the Grafana dashboard
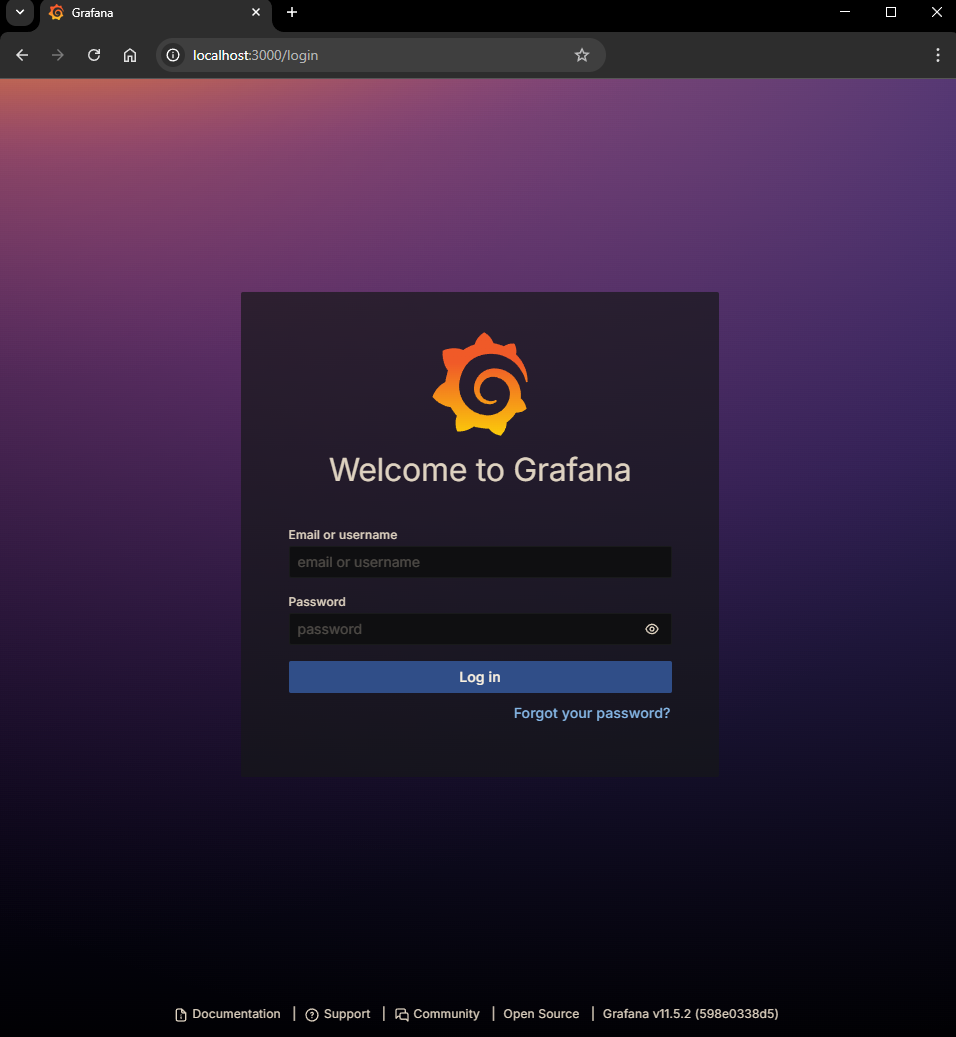
By default, Grafana is only accessible from within the cluster. Use port forwarding to view it locally.Open Grafana
Open http://localhost:3000 in your browser.
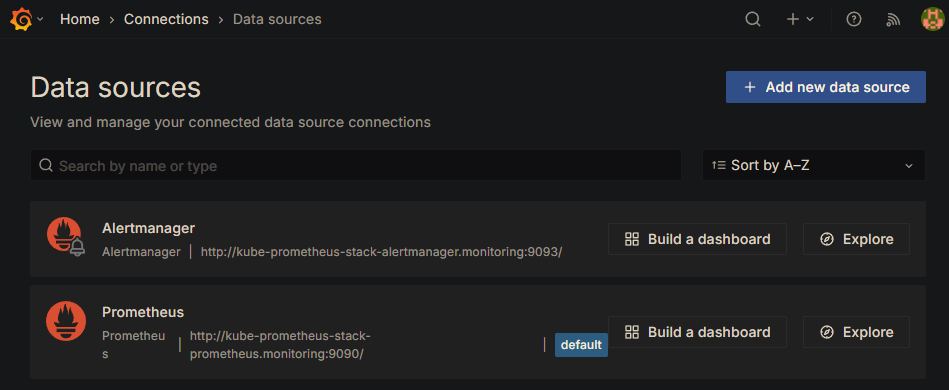
Step 5: Confirm Prometheus as a data source
Thekube-prometheus-stack automatically sets up Prometheus as a data source in Grafana. To check:
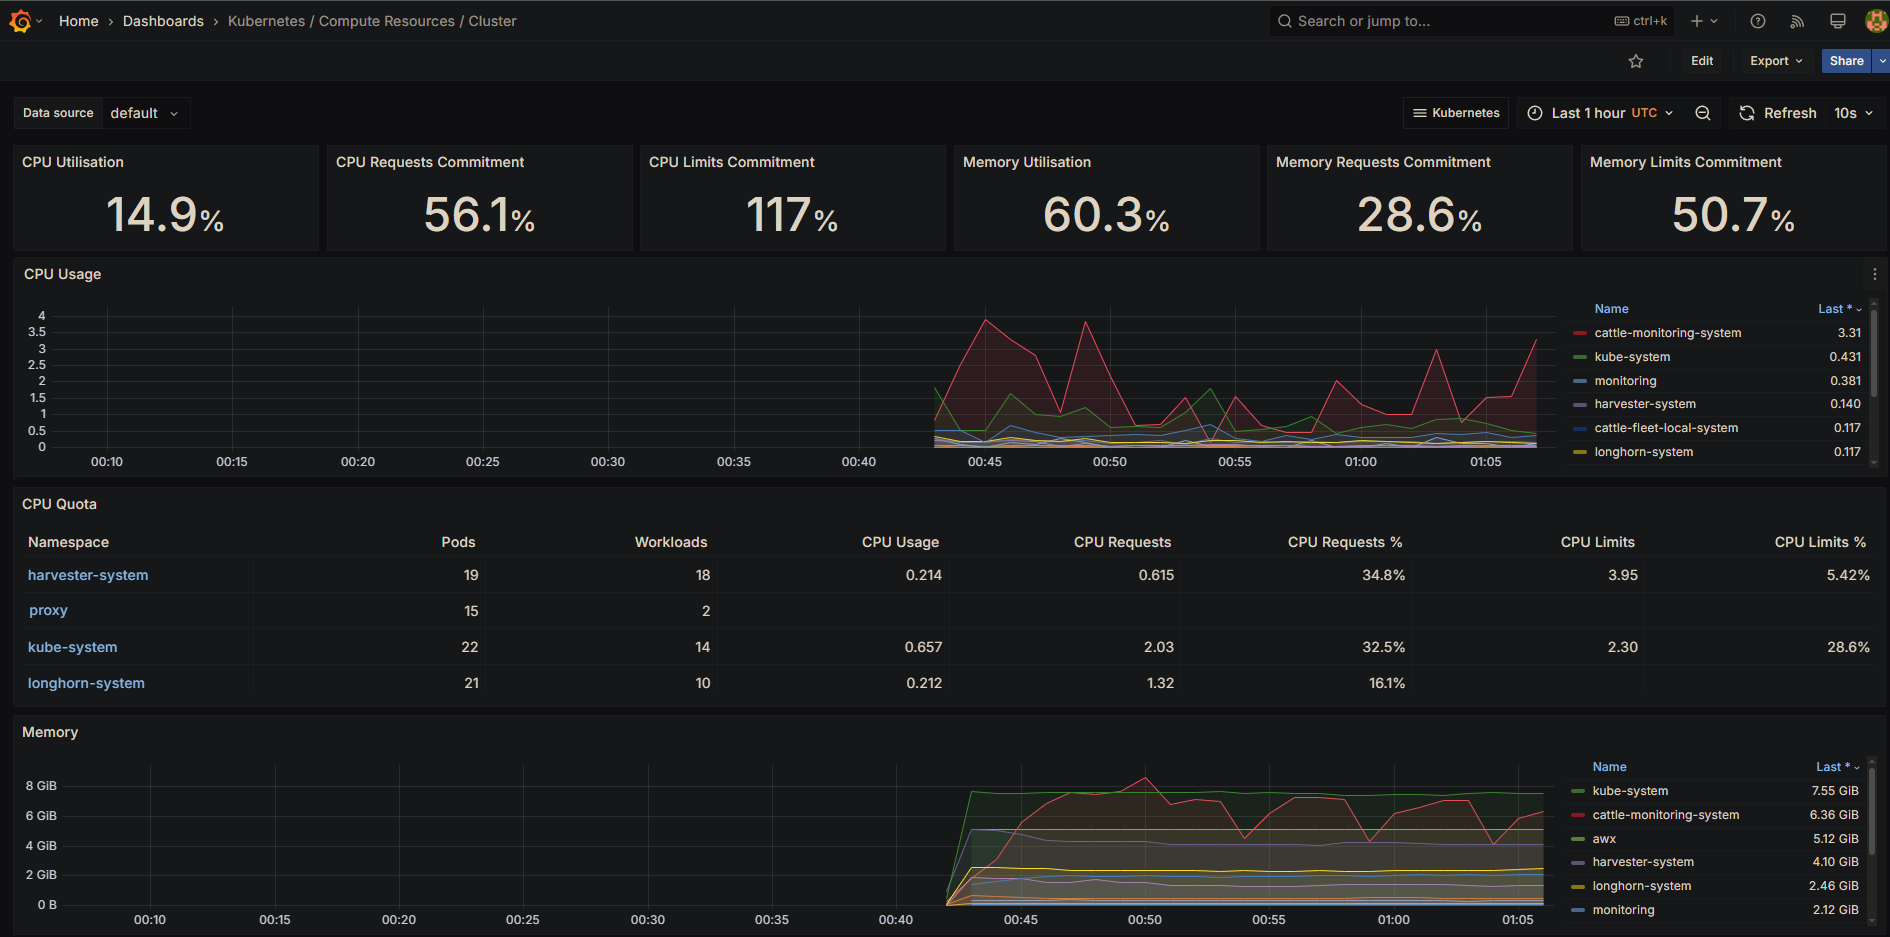
Step 6: Explore dashboards
Grafana includes several pre-built dashboards out of the box. To access them: For a high-level overview, start with Kubernetes / Compute Resources / Cluster. This dashboard provides insights into:- Overall cluster CPU, memory, and filesystem usage.
- Pod and container performance.
- System service metrics.
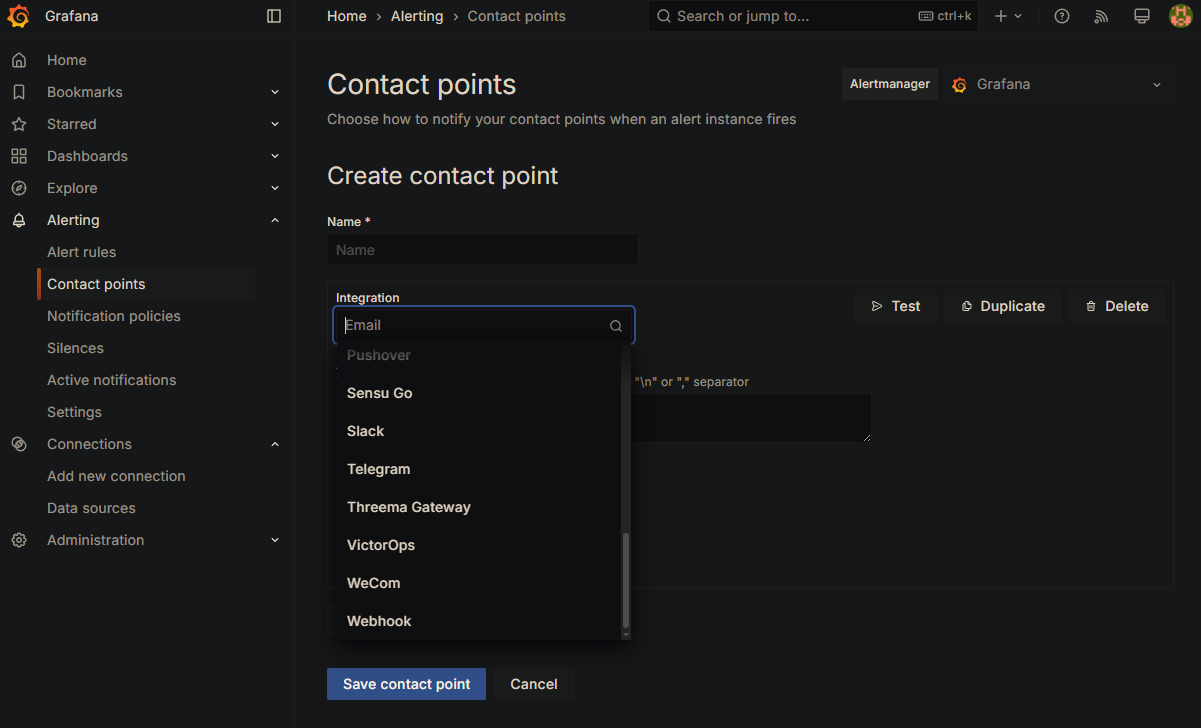
Step 7: Set up basic alerts
Alertmanager is already included as part of the kube-prometheus-stack. To manage alerts: