Topbar
Team switcher
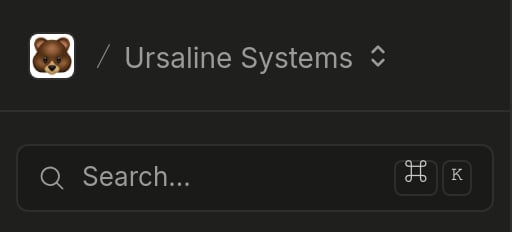
The team switcher sits in the top left corner. Everything in the dashboard is scoped to the team you pick here: each team is a separate context, with its own projects, resources, billing, and members.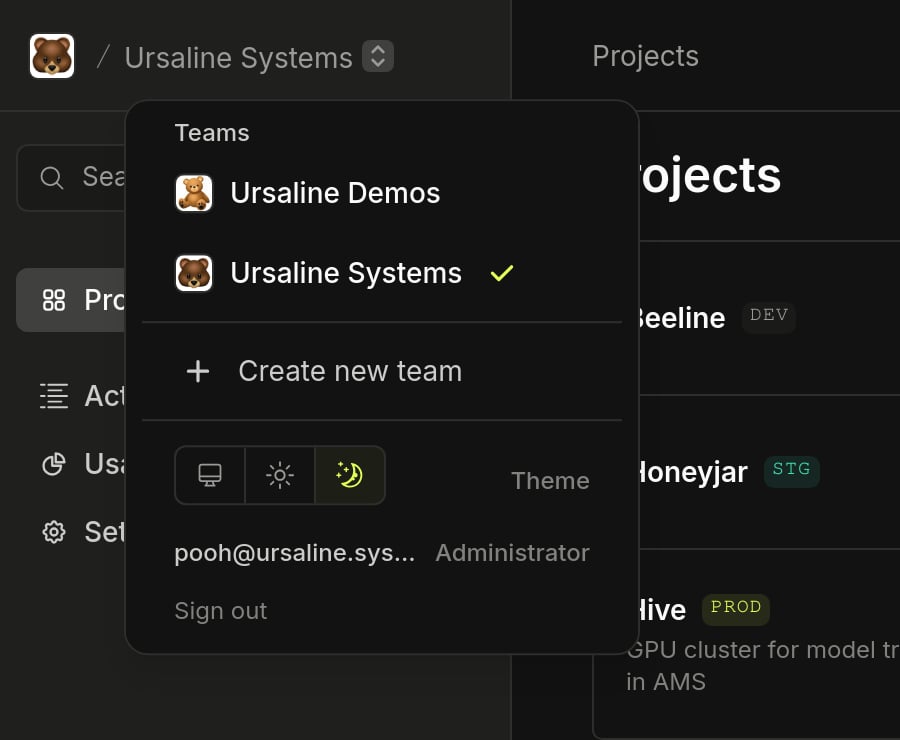
- Switch teams: pick another team from the list to move between them.
- Create new team: need a separate space for another company or client? Create a new team from this menu.
- Theme: choose system, light, or dark. It applies to the whole dashboard.
- Account: your email and role in the current team. Click it to open your account and user preferences.
- Sign out: ends your session on this device.
Feedback
Click Feedback in the top right corner to share your thoughts with us. Type your message, select an emoji that matches your experience, and hit Send. It lands with the product team, and we read every one.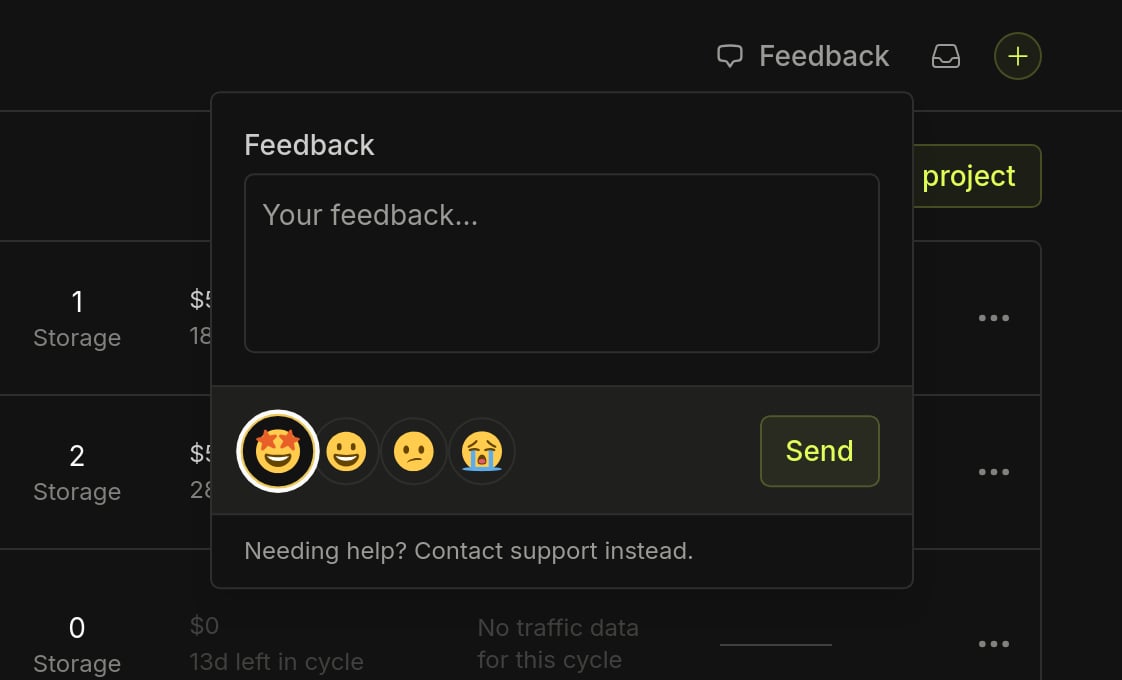
Notifications
The notifications icon, next to Feedback, collects important account notifications: account verification, billing alerts, and overdue invoices.
Add
The + button is the fastest way to create something in the current team: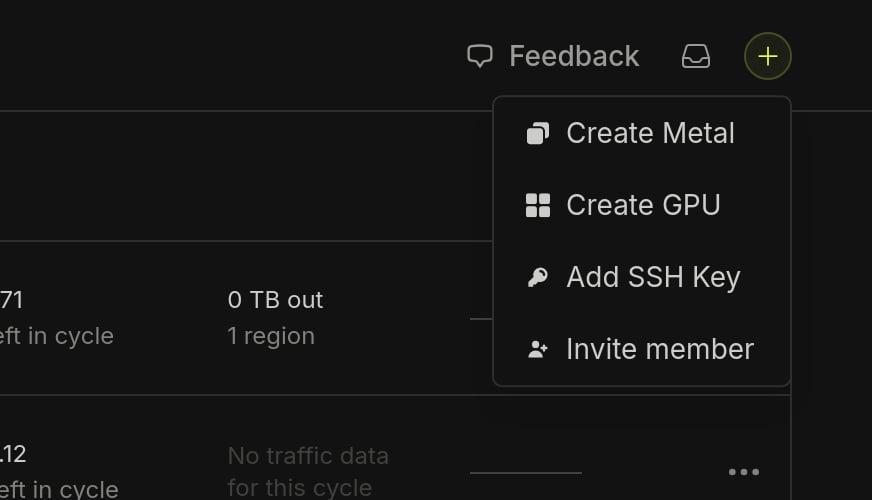
- Create Metal: deploy a bare metal server. Pick a plan, a location, and an OS.
- Create GPU: deploy a bare metal server with dedicated GPUs.
- Add SSH Key: add an SSH key once and use it across your team’s resources.
- Invite member: invite a team member. Roles control what they can see and do.
Sidebar
The sidebar is the primary way to navigate the dashboard. At the team scope it gives you Search, Projects, Activity, Usage & billing, and Settings. Inside a project, the middle section switches to that project’s resources, such as Compute, Network, Storage, and Interconnection, plus Project settings.Search
Search across projects, servers, and settings from one place. The search bar is the command menu: the same menu you can bring up from anywhere in the dashboard with⌘ + K (or Ctrl + K on Windows).
Projects
Projects group your resources: servers, network, storage, and whatever you deploy next. Each project tracks its own usage and cost, and is billed separately. The Projects page is your home page. It lists every project in the team with its environment, resource counts for Compute, Network, and Storage, the spend and days left in the current billing cycle, and outbound traffic per region. Click a project to open it and deploy and manage its resources, or click Create project to start a new one.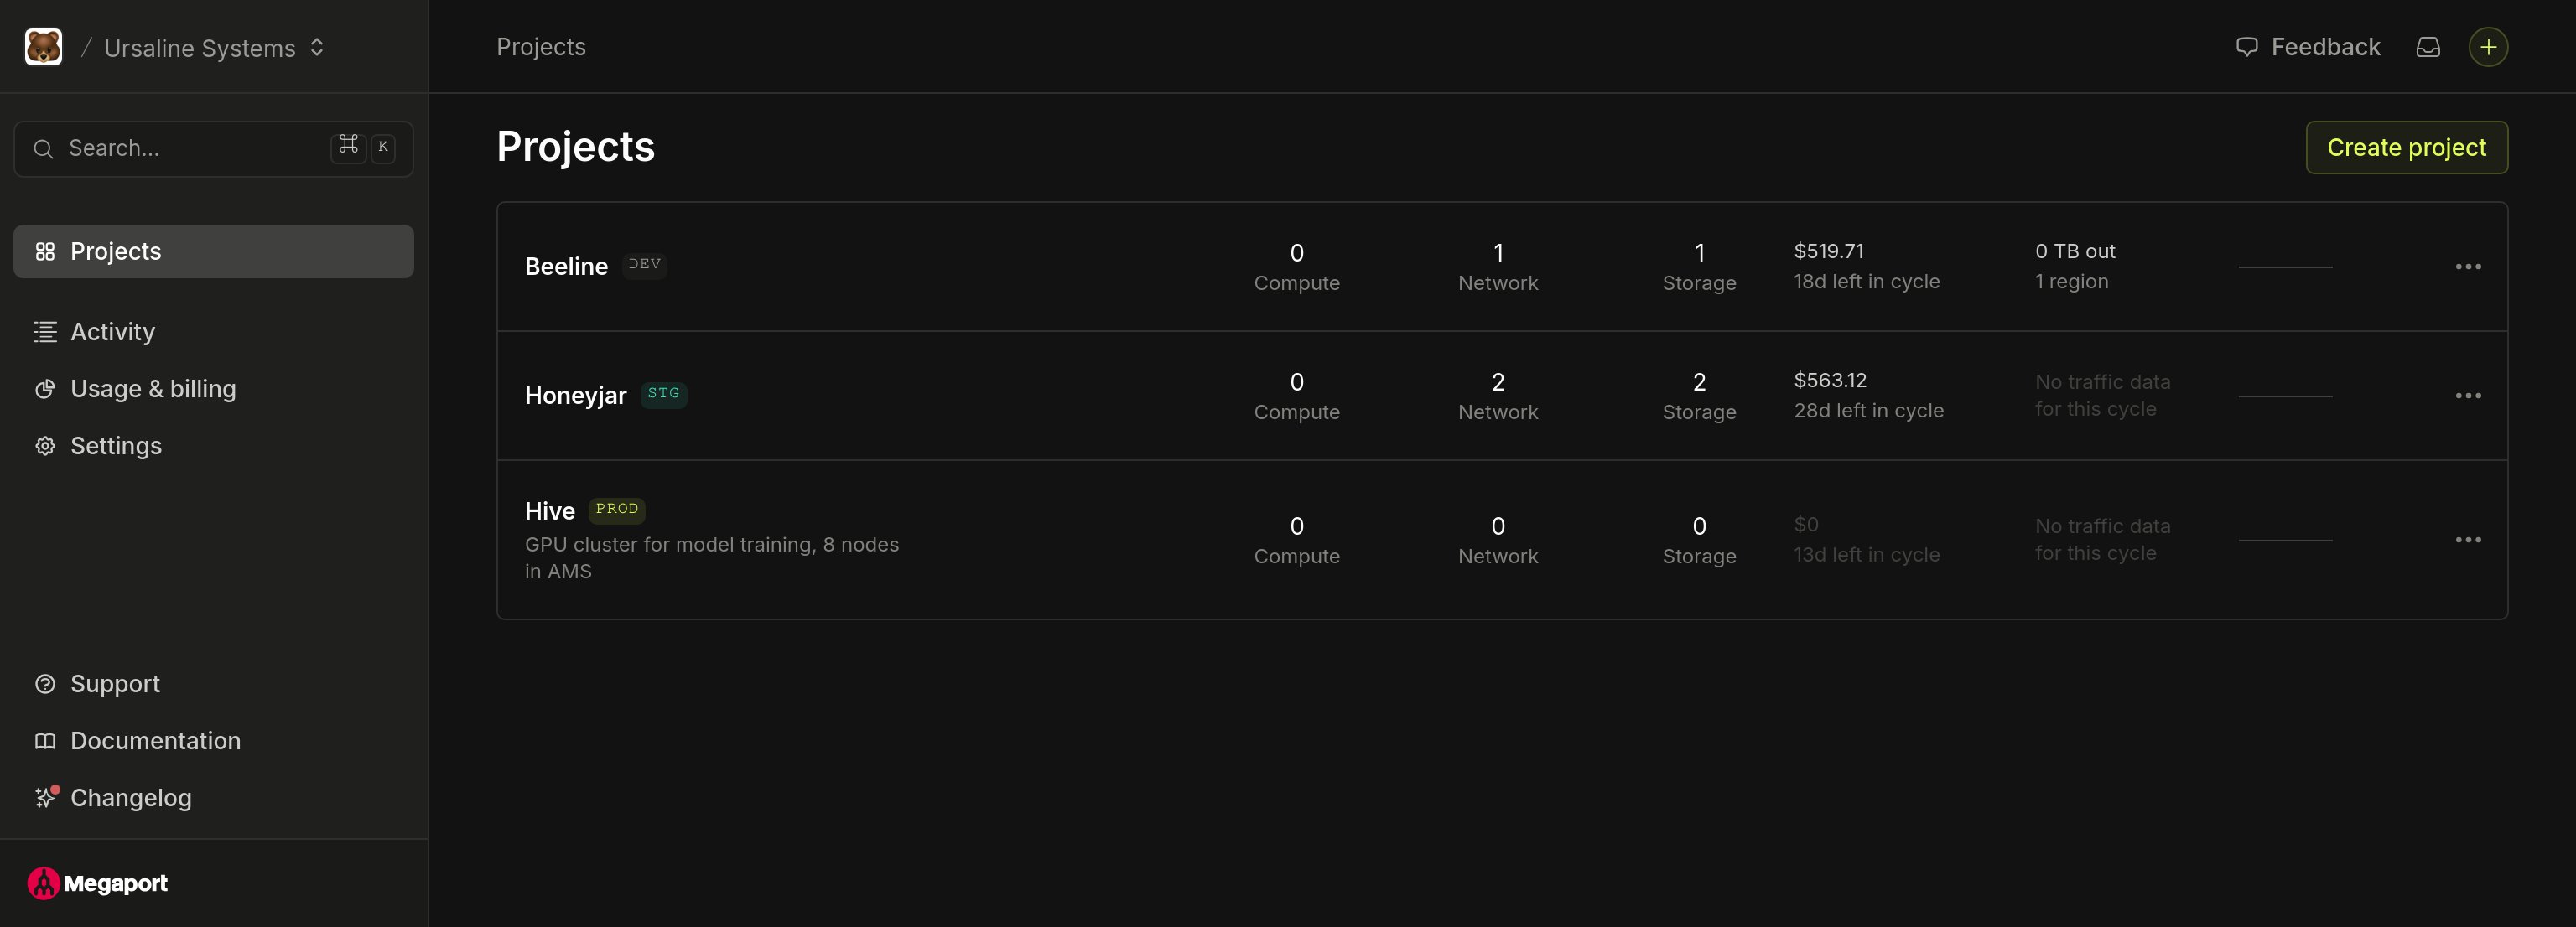
Activity
Activity is the audit log for the team: who did what, and when.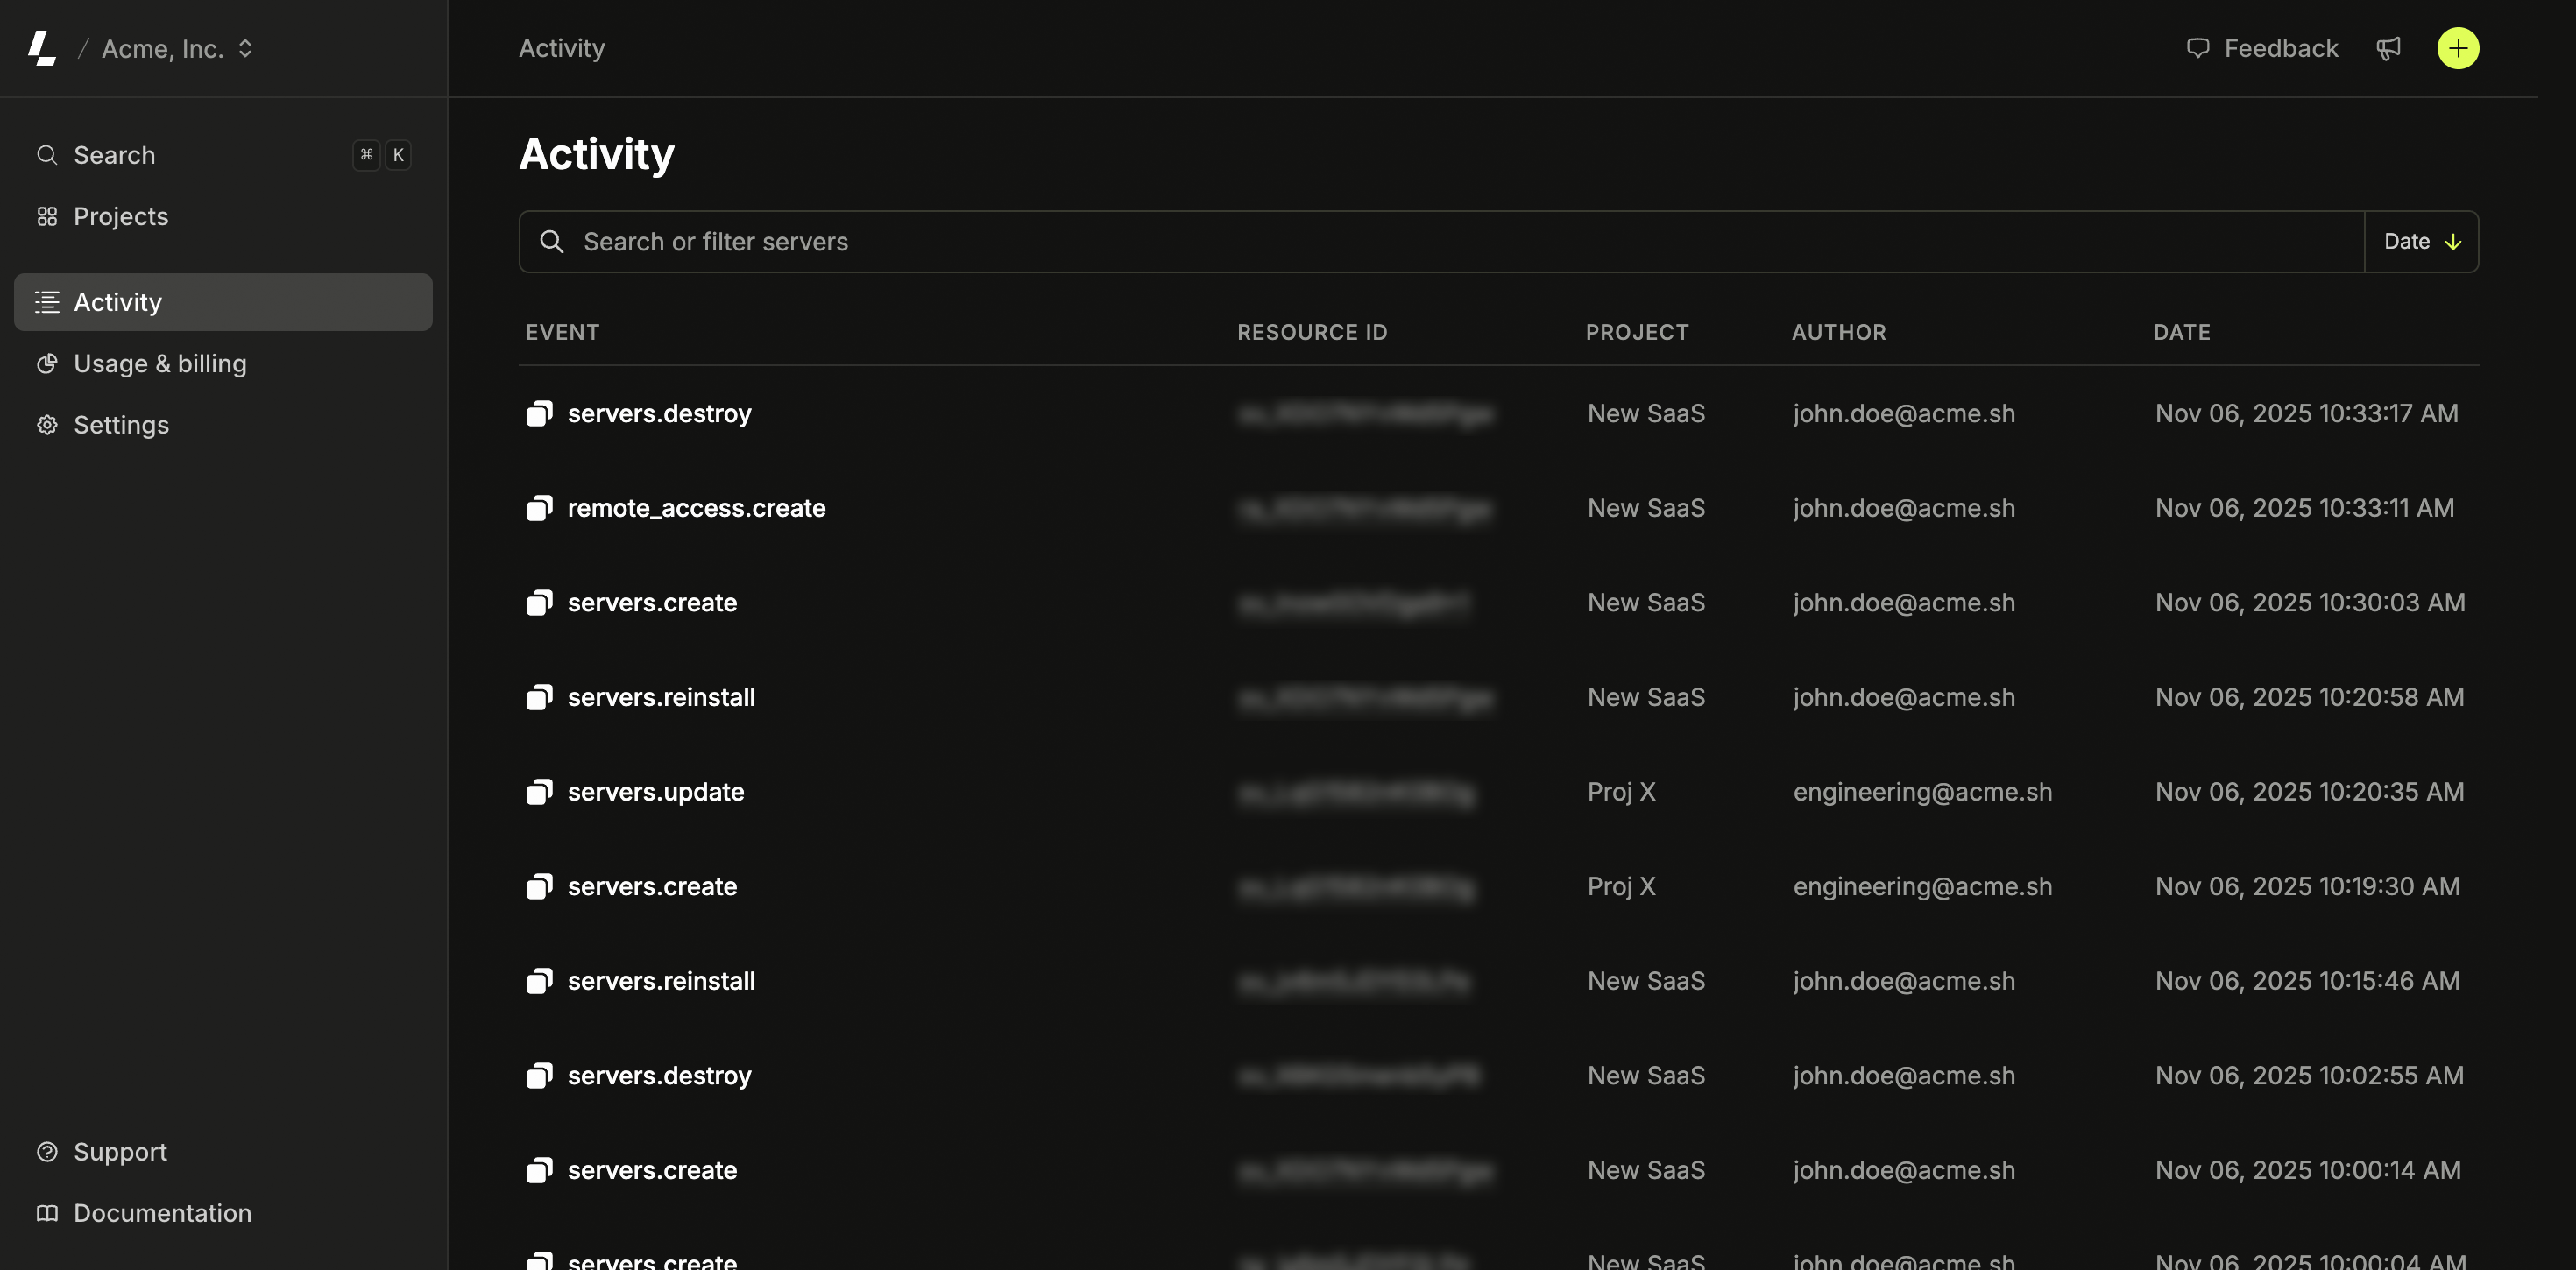
Usage & billing
Usage & billing shows spend per project, invoices, and the current billing cycle. It groups Bandwidth, Resources, Invoices, Billing, and Resource quotas.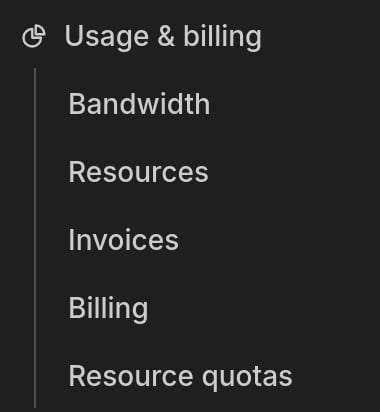
Settings
Settings covers the team and your own account: General, Members & access, Tags, API Keys, Referral, and Profile.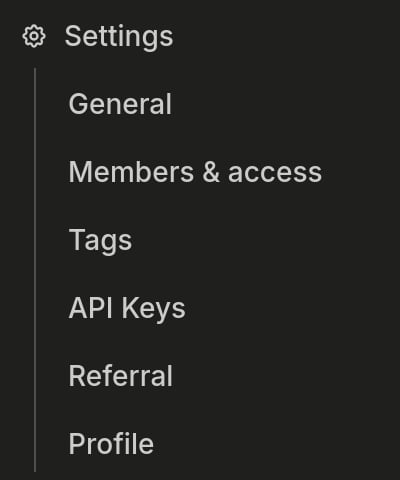
Support
Contact support for help or to find quick answers. The Support page has a Team tab, where everyone on the team can see and follow team-wide tickets, and a Personal tab for your own tickets. From there you can also grant support account access.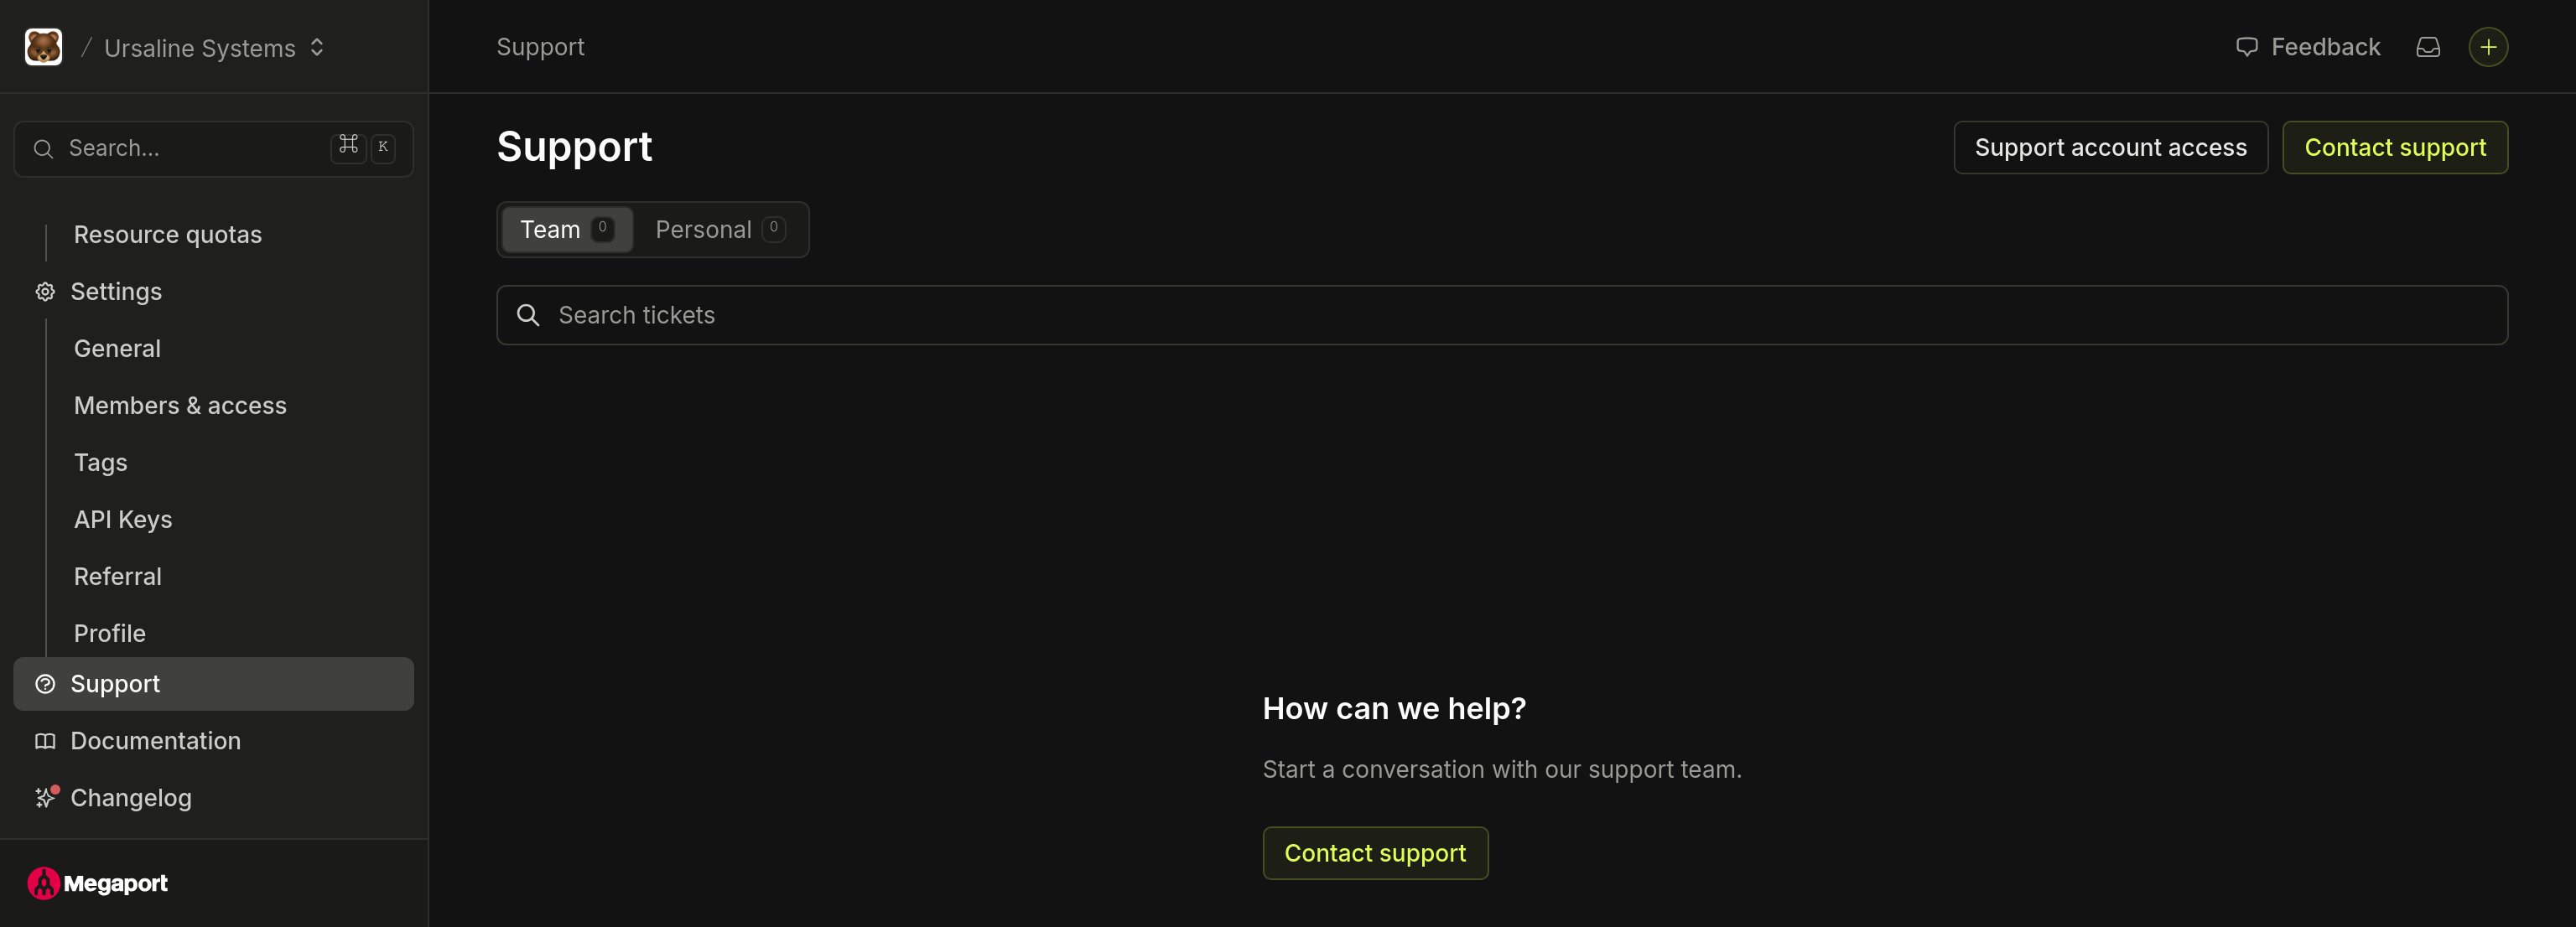
Documentation and Changelog
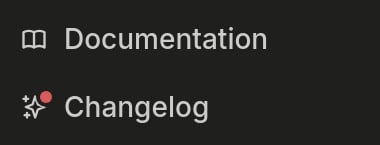
The last two items in the sidebar: Documentation opens these docs for in-depth guidance and troubleshooting, and Changelog lists the latest platform improvements.